Ending the Epidemic Logo
  • ABOUT
    • About ETE
    • Data Sources
    • Acronyms
  • DATA
    • Directory
    • ETE Metrics
    • Community Snapshot
  • IMPLEMENTATION
    • ETE Policy Tracker
    • ETE Programs in NYC
  • BLOG
  • RESOURCES
    • Infographics
  • Sign Up
  • Post
  • New interactive tool tracks...

New interactive tool tracks key HIV related trends

By ETE Dashboard |

December 19th, 2022 |

Categories:

AnnouncementsBlog
|

Tags: |

0 Comments

  • Facebook
  • Twitter
  • Linkedin

The ETE Dashboard has launched a new data visualization tracking key measures of the HIV/AIDS epidemic in New York State. This newly launched Dashboard feature combines multiple HIV related outcomes into a single chart view, allowing users to explore trends in new HIV diagnoses, AIDS diagnoses, people living with diagnosed HIV (PLWDH) and number of PLWDH who are virally suppressed. The New York City version also incorporates deaths among PLWDH.

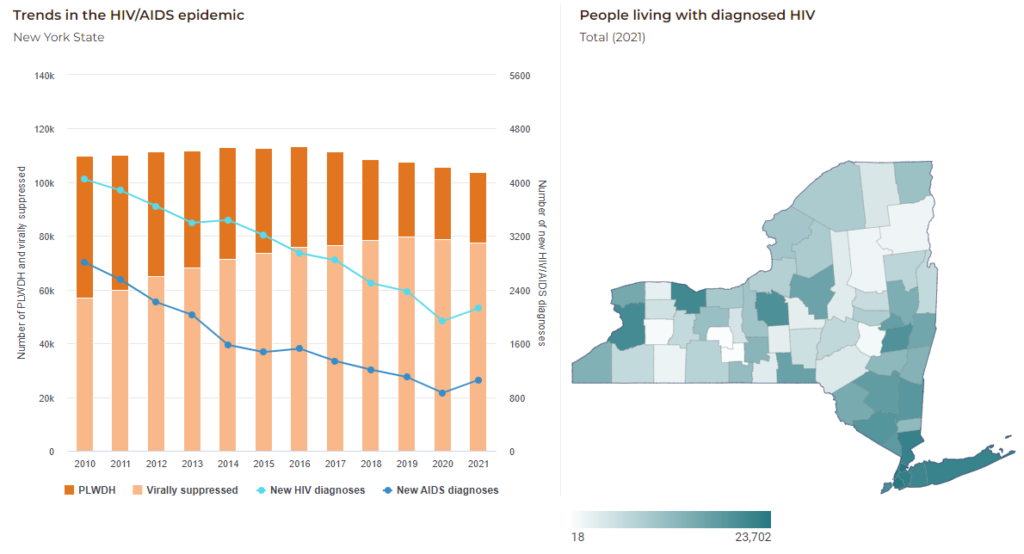
Data are available at the statewide, Ryan White Region, and county levels; in NYC, data are available by borough and UHF Neighborhood. Dashboard users can also filter data by sex (NYS), gender (NYC), age, race, and risk factor. 

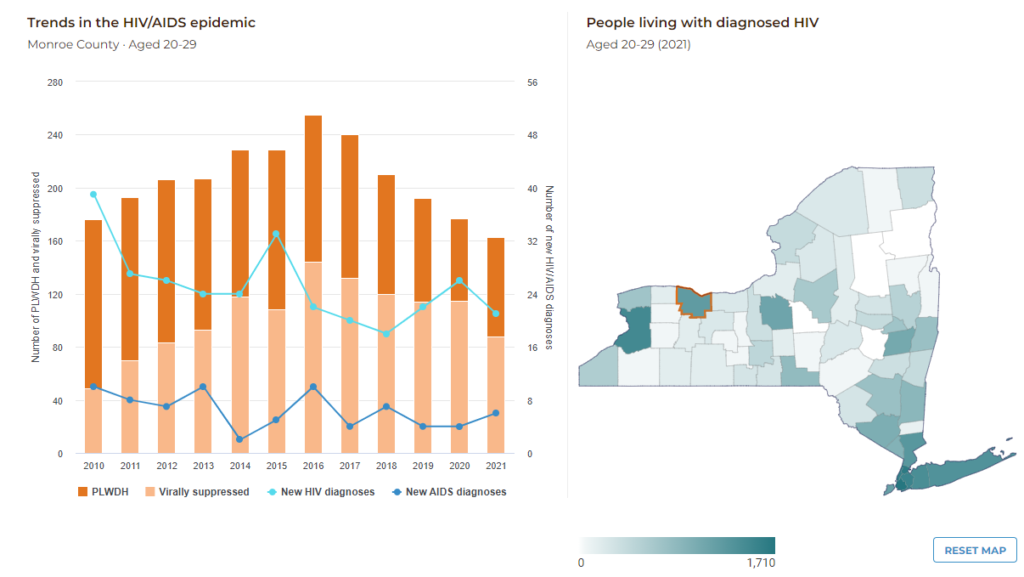
For ETE stakeholders who want to view data for different communities or specific populations of interest, this interactive tool makes these key HIV related trends quickly accessible.  For example, if you are a program manager, service provider, or local health department worker in Rochester, NY, the image below highlights trend data for people aged 20-29, living with HIV in Monroe County going back to 2010. 

Visit the New York State and New York City HIV Epidemic Summary pages to explore the data!


Post navigation

Previous
Next

Search

Navigation

  • 2025
    • February
  • 2024
    • December
    • October
    • September
    • June
    • May
    • April
    • March
    • February
    • January
  • 2023
    • December
    • November
    • October
    • September
    • August
    • June
    • May
    • April
    • March
    • January
  • 2022
    • December
    • November
    • October
    • September
    • June
    • May
    • April
    • March
    • February
  • 2021
    • December
    • November
    • October
    • September
    • May
    • March
    • February
  • 2020
    • December
    • November
    • October
    • September
    • April
    • March
    • February
  • 2019
    • December
    • November
    • September
    • July
    • June
    • May
    • March
    • February
  • 2018
    • December
    • October
    • September
    • July
    • June
    • May
    • April
    • February
    • January
  • 2017
    • December
    • November
    • October
    • September
    • August
    • July
    • June
    • May
    • February
    • January
  • 2016
    • December
    • November
    • October
    • September
    • August
    • July
    • June
    • May
    • April
    • February
  • 2015
    • December
    • November
    • October
    • September

We want to hear from you!

Give us your feedback

about the ETE Dashboard

DESIGNED AND DEVELOPED BY:
CUNY Institute for Implementation Science in Population Health
FUNDED BY:
CONNECT WITH US:

Subscribe to get updates:

Subscribe your Email

For general inquiries email:
info@etedashboardny.org