Ending the Epidemic Logo
  • ABOUT
    • About ETE
    • Data Sources
    • Acronyms
  • DATA
    • Directory
    • ETE Metrics
    • Community Snapshot
  • IMPLEMENTATION
    • ETE Policy Tracker
    • ETE Programs in NYC
  • BLOG
  • RESOURCES
    • Infographics
  • Sign Up
  • Post
  • Newly released 2019 ETE...

Newly released 2019 ETE Metrics, HIV Surveillance, and PrEP utilization data now available on the ETE Dashboard

By ETE Dashboard |

December 3rd, 2020 |

Categories:

Blog
|

Tags: |

0 Comments

  • Facebook
  • Twitter
  • Linkedin

Newly released 2019 HIV surveillance and PrEP and PEP utilization data is now available on the ETE Dashboard’s data visualization platform.  These interactive tools allow our users to view HIV care continua, trends among persons with newly diagnosed HIV, and trends in PrEP and PEP use by geographic area (e.g. Ryan White Region, county, UHF neighborhood), and by gender, age, race/ethnicity, and transmission risk group when available.  Click on the links below to explore the data!

  • HIV Care Continuum among all people living with HIV:                       NYS | NYC
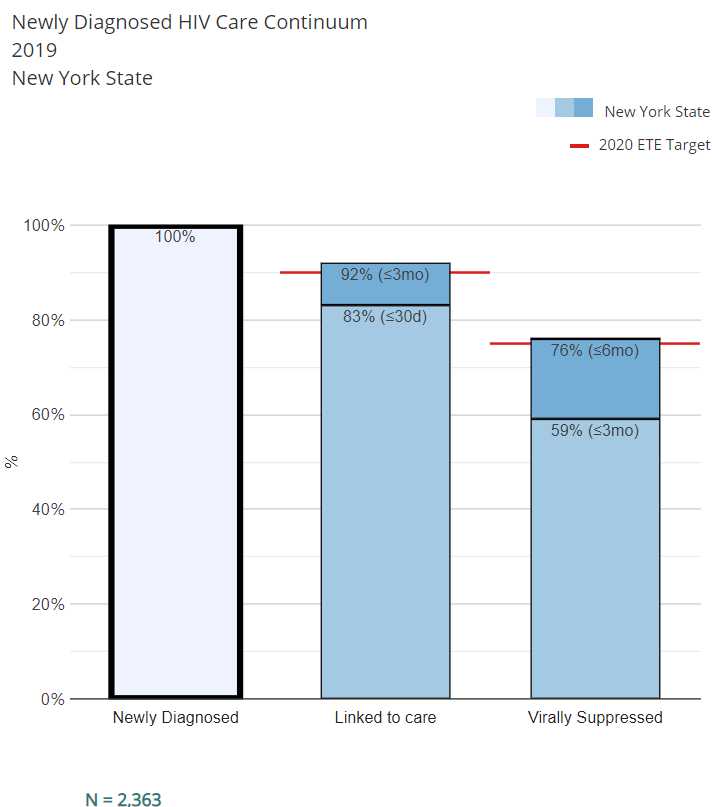
  • HIV Care Continuum among people with newly diagnosed HIV:       NYS | NYC
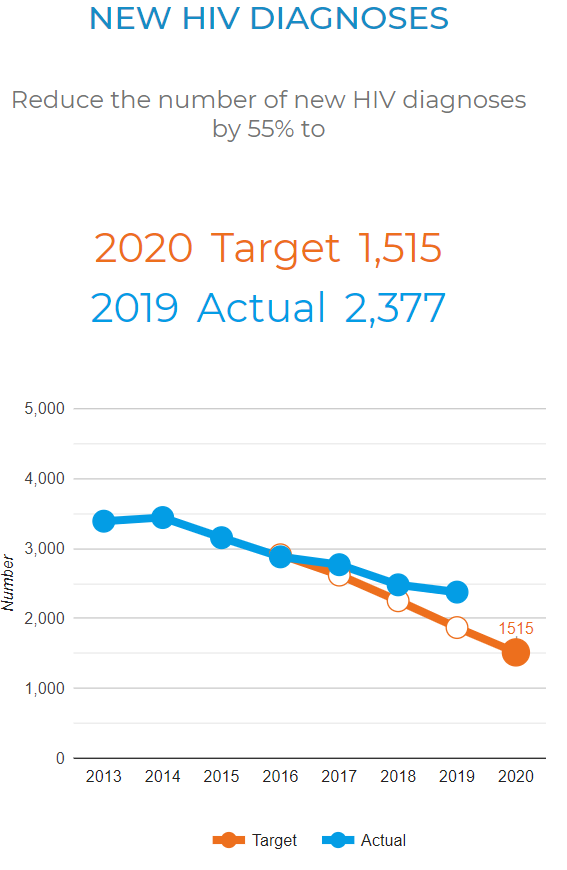
  • Trends among people with newly diagnosed HIV:                               NYS | NYC
  • PrEP utilization
  • PEP utilization

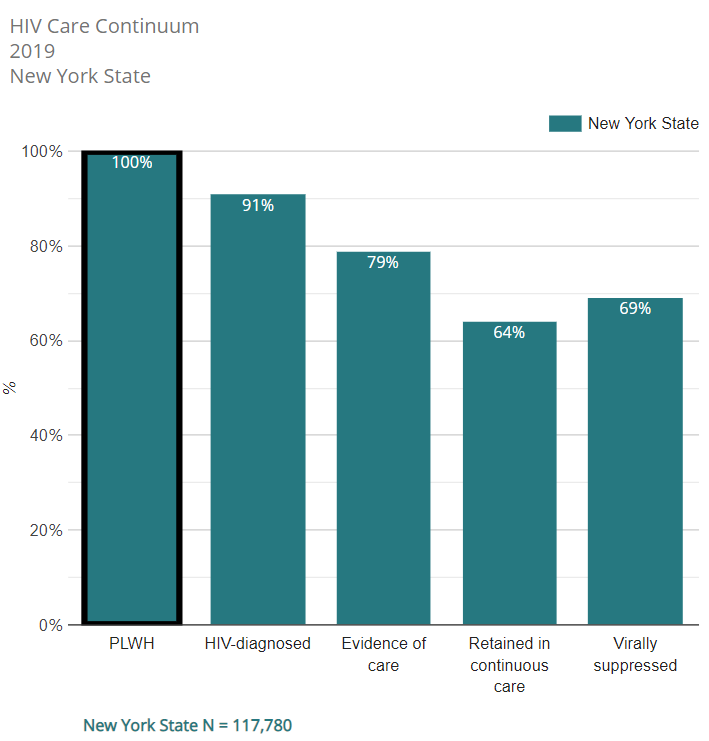
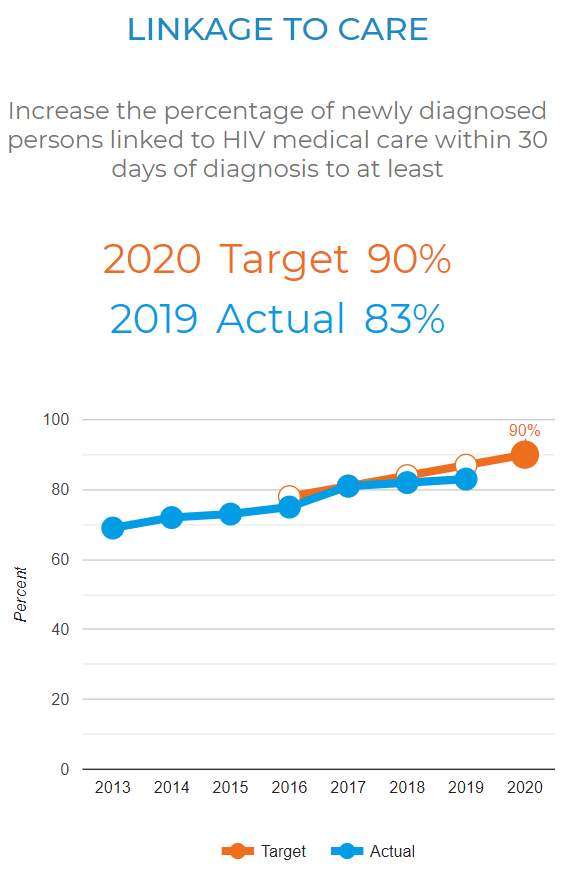
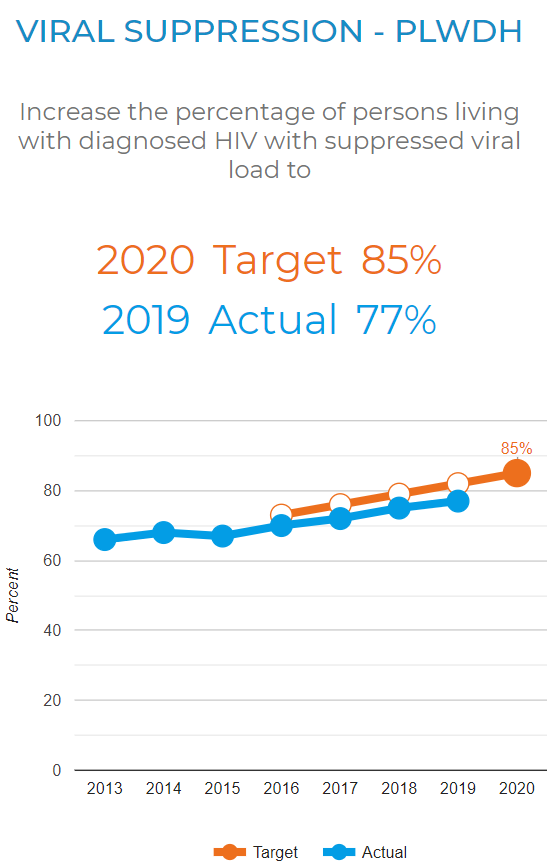
The ETE Dashboard’s newly updated ETE Metrics page presents the latest available data for both New York State and New York City, showing progress to date towards the official NYS Ending the Epidemic Initiative targets.  Annual data is now viewable by race/ethnicity both at the Statewide and NYC citywide levels.

Post navigation

Previous
Next

Leave a Reply Cancel reply

You must be logged in to post a comment.

Search

Navigation

  • 2025
    • February
  • 2024
    • December
    • October
    • September
    • June
    • May
    • April
    • March
    • February
    • January
  • 2023
    • December
    • November
    • October
    • September
    • August
    • June
    • May
    • April
    • March
    • January
  • 2022
    • December
    • November
    • October
    • September
    • June
    • May
    • April
    • March
    • February
  • 2021
    • December
    • November
    • October
    • September
    • May
    • March
    • February
  • 2020
    • December
    • November
    • October
    • September
    • April
    • March
    • February
  • 2019
    • December
    • November
    • September
    • July
    • June
    • May
    • March
    • February
  • 2018
    • December
    • October
    • September
    • July
    • June
    • May
    • April
    • February
    • January
  • 2017
    • December
    • November
    • October
    • September
    • August
    • July
    • June
    • May
    • February
    • January
  • 2016
    • December
    • November
    • October
    • September
    • August
    • July
    • June
    • May
    • April
    • February
  • 2015
    • December
    • November
    • October
    • September

We want to hear from you!

Give us your feedback

about the ETE Dashboard

DESIGNED AND DEVELOPED BY:
CUNY Institute for Implementation Science in Population Health
FUNDED BY:
CONNECT WITH US:

Subscribe to get updates:

Subscribe your Email

For general inquiries email:
info@etedashboardny.org